What you can do with timeline boards
A Timeline board represents your items in time. Timeline boards work well in scenarios like:
- Product roadmap presentations for marketing, R&D, and other stakeholders;
- Department annual plans for resource managers;
- Project timelines for project managers and project teams.
You can drag cards and flags in the timeline to change time, duration, and swimlanes of the items.
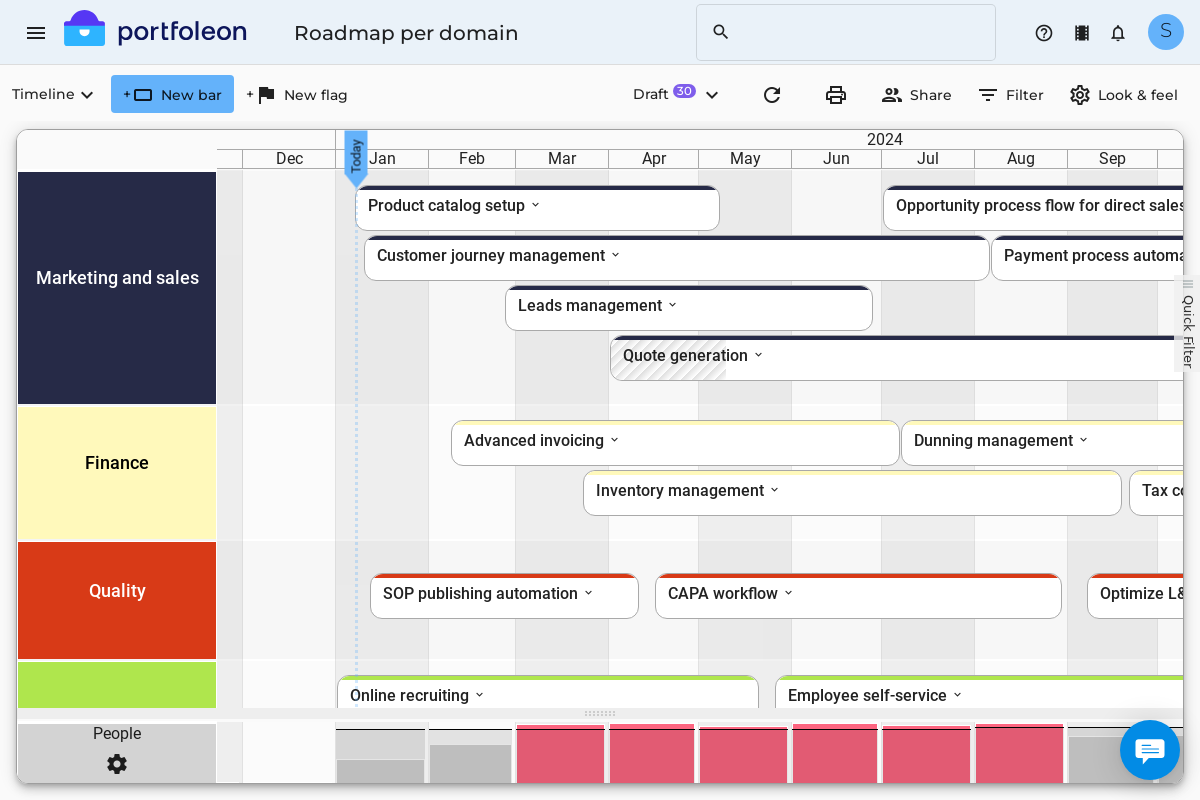
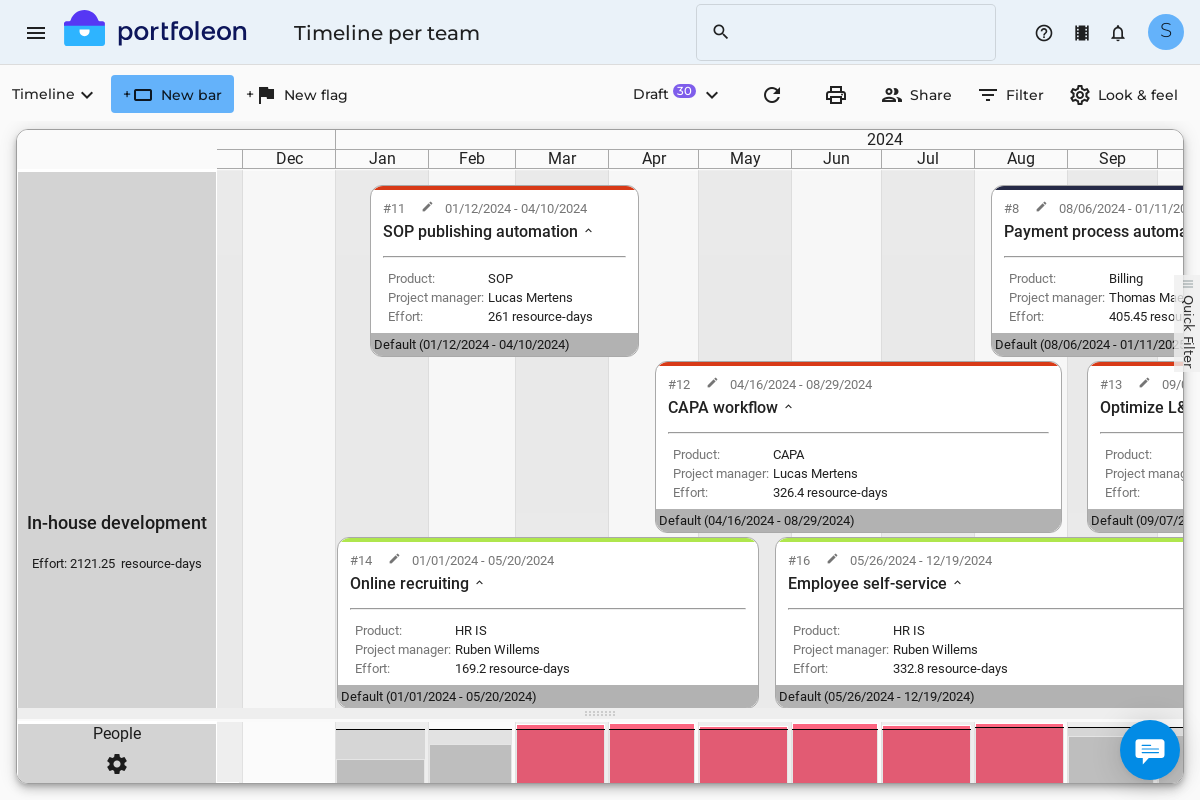
Here are a few examples of what you can achieve with timeline views:
Timeline board controls
Drag an item horizontally to reschedule.
Drag an edge of an item to resize.
Drag an item vertically to change the swimlane. Shift+Drag vertically to make sure dates are unchanged.
Click an item to open the editor form.
How to set up a timeline board
How to define timeline swimlanes
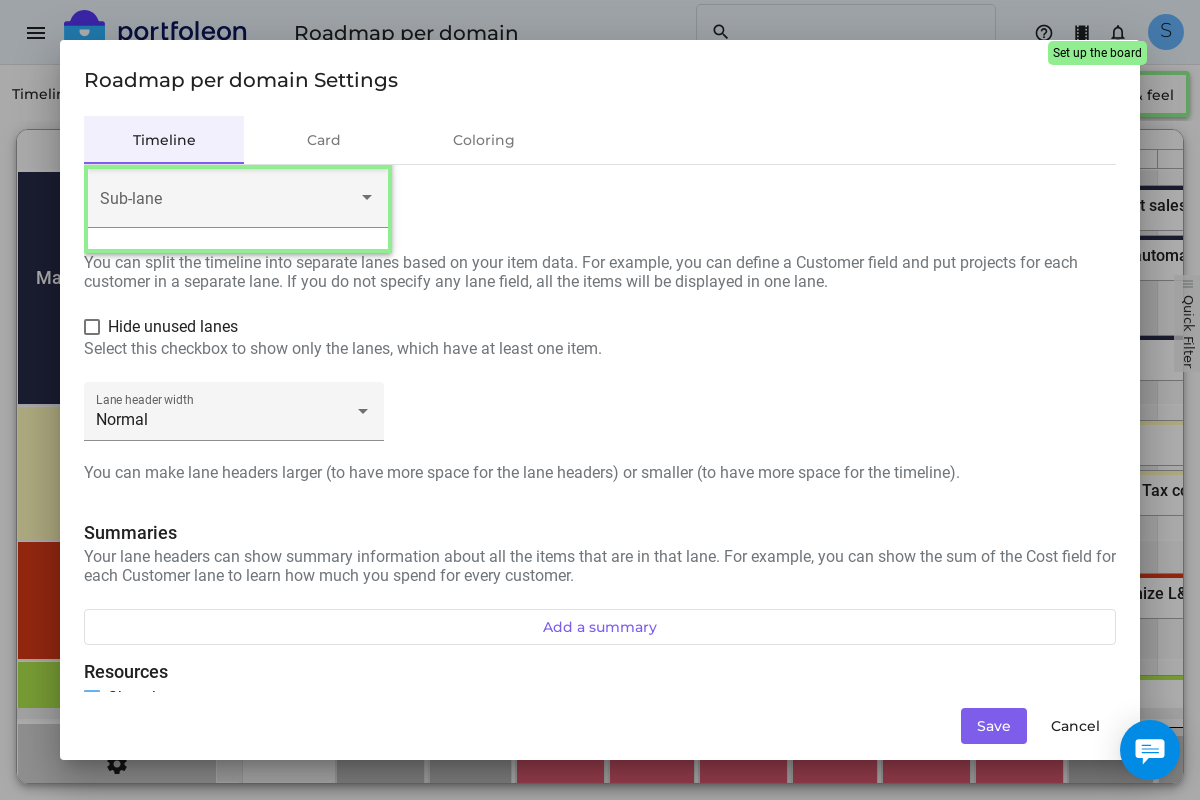
You can group your timeline items in swimlanes. To define your swimlanes, please first click Look & feel, then select the field that you want to group on in the Lane dropdown.
You can define sub-lanes - for this select another field in the Sub-lane dropdown.
How to define lane summaries
Your lanes can show summary data, for example the total Budget of items in the lane, or the average Complexity Score.
This is how it looks like:
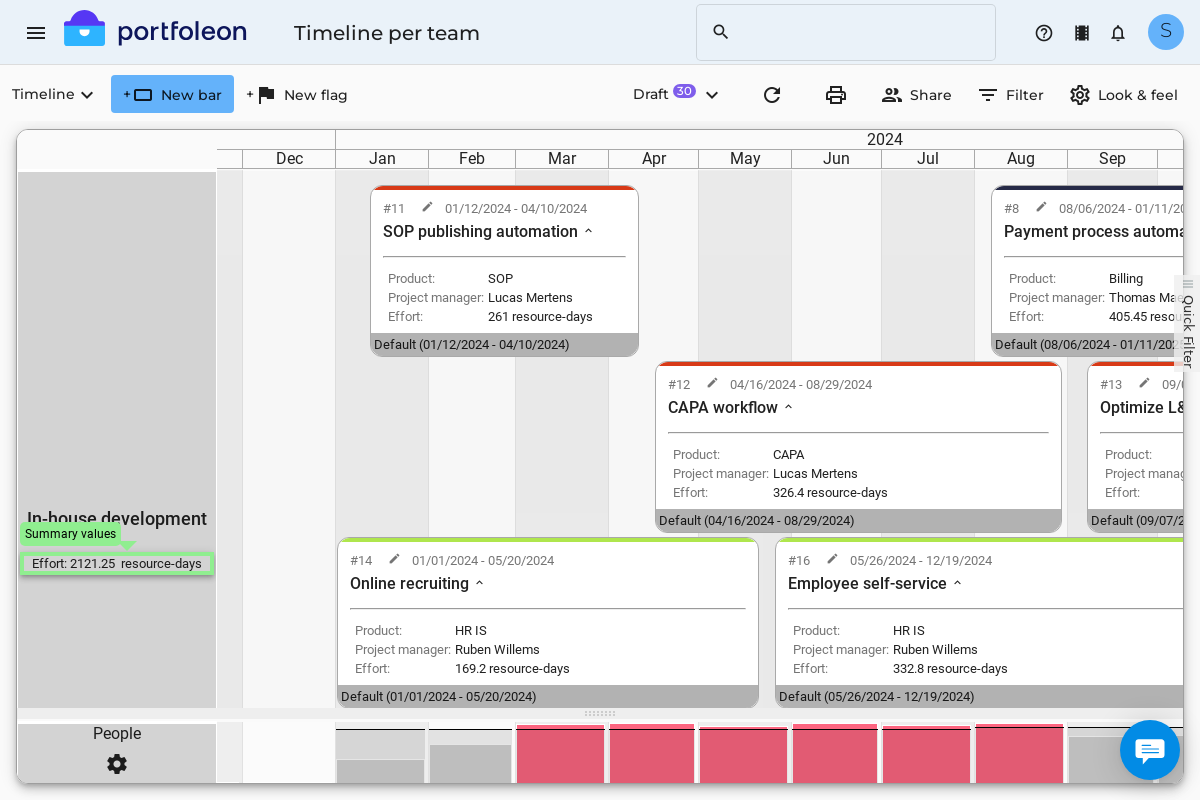
To define a lane summary, please first click Look & feel, then in the Summaries section click Add a summary button and select any Number field you want to have a summary on.
Show resources
You can display resource load hints under the timeline to help you to schedule the work. Here’s how this can look like:
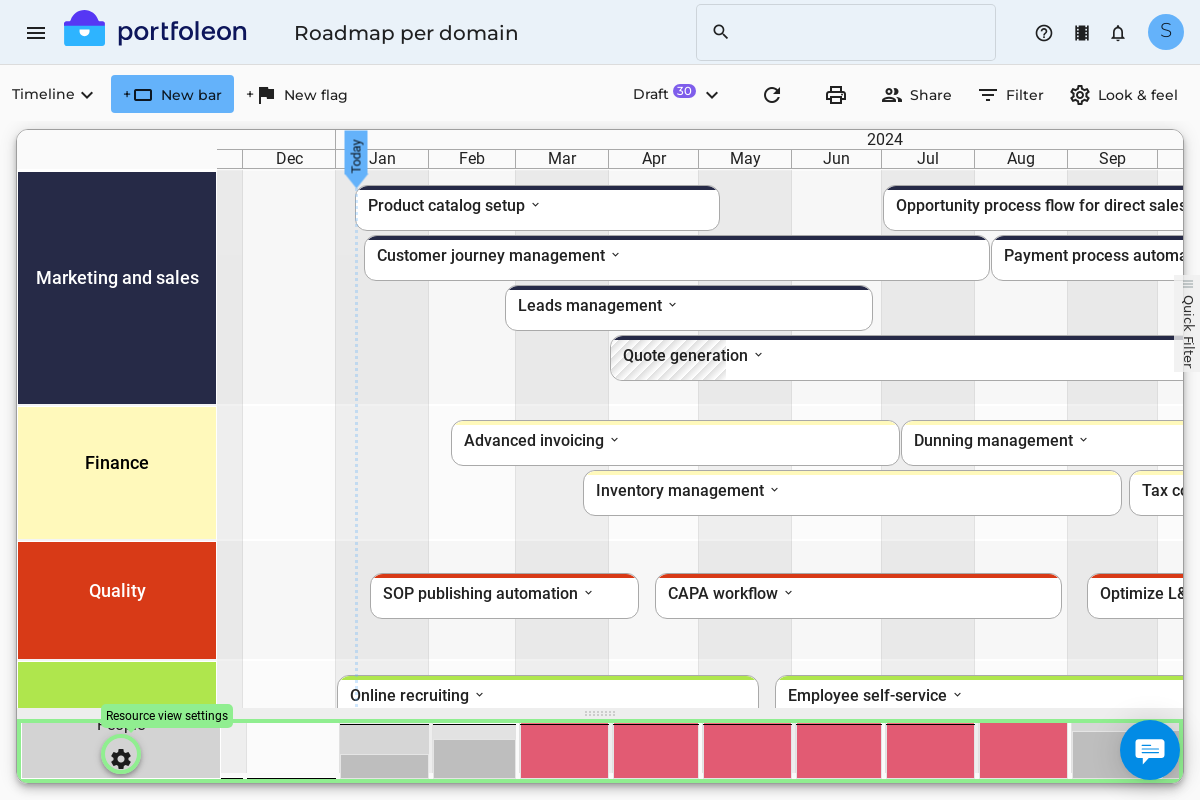
Start by clicking Look & feel, and then in the Resources section click the Show Resources checkbox. You will see the resource load swimlane appear under your timeline. It will show available resources that you defined using Resource management, and booked resources that you indicated in the Resource demand for your items.
You can tune this additional swimlane to display just the information you need. Click the gear icon on the resource load swimlane header.
Here you can set up which resources will be shown, what the columns will mean, and also define the “yellow” vs. “red” overload threshold.
The resource load swimlane displays elements, which can consist of a bar and two “caps” - solid and dotted. By default they mean:
- Bar height represents total resource demand;
- Solid “cap” represents total available capacity;
- Dotted “cap” represents budgeted available capacity.
If the total demand is greater than the total resource capacity, the bar will be shown red, otherwise it will be shown grey.
You can redefine what bars and caps mean - for example, you can say that your solid cap represents the budget, and the dotted cap represents capacity. In any case, Portfoleon will highlight bars with red if they exceed the solid cap threshold.
Sometimes you will want to define an extra threshold to differentiate between a minor and a major overload. In this case, you can set the FTE warning level with a percentage that indicates a major overload. For example, if you indicate 10%, any overloads below ten percent will show as yellow, while overloads of ten percent or more will show as red.
Overriding start date and scale
Usually Portfoleon will automatically adjust display start date and scale. If you are not happy with the default settings, you can set the desired start date and column scale in the timeline settings.
Start date means the date, which will be on the leftmost edge when you open the timeline. You may want to adjust it if you have a lot of projects in the past, but you want to focus the attention of the viewer on more recent projects.
Column scale defines the time unit that one timeline column will represent: a day, a week, a month, or a year.
To set up the start date and column scale override, please please first click Look & feel, then update the settings in the Timeline boundaries section.
How to define what you can see on a card
You can choose to display very simple cards showing just your item name, but you can also choose to display a lot of additional information on your timeline cards.
Here’s how it may look like:
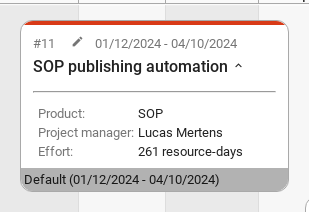
To define what you can see on your card, please first click Look & feel, then go to the Card tab, and choose the data to display.
How to color-code cards
You can define card colors based on their field values. To set up color-coding, please first click Look & feel, then go to the Coloring tab, and define your color schema.