From goals to real results
With structured planning, meaningful prioritization, and ongoing visibility, Portfoleon helps teams stay aligned and actually deliver on strategy.
Plans, objectives, and key results
In Portfoleon, a plan is built around a set of objectives and key results. Each objective is weighted to reflect its importance within the overall plan, while key results are structured, specific, and measurable – providing clarity and focus.
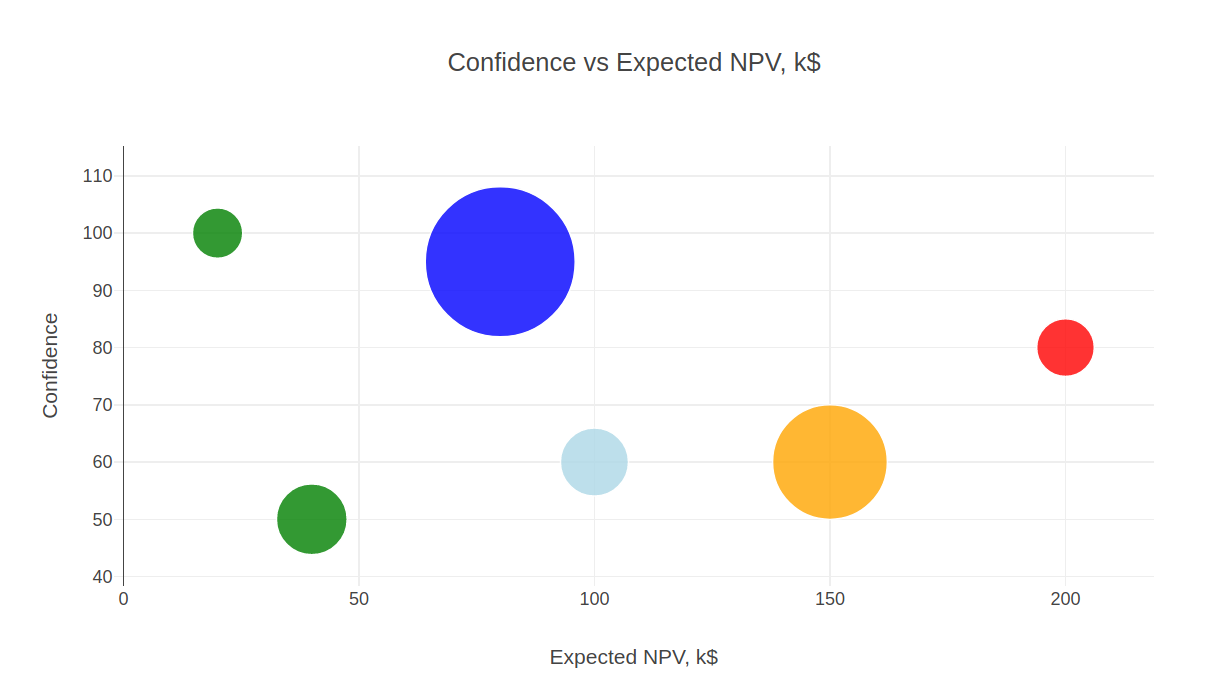
Projects prioritization based on contribution to outcomes
In Portfoleon, each project can support one or more key results. Both the planned and actual contributions are quantified – making it easier to see which work actually moves the needle.
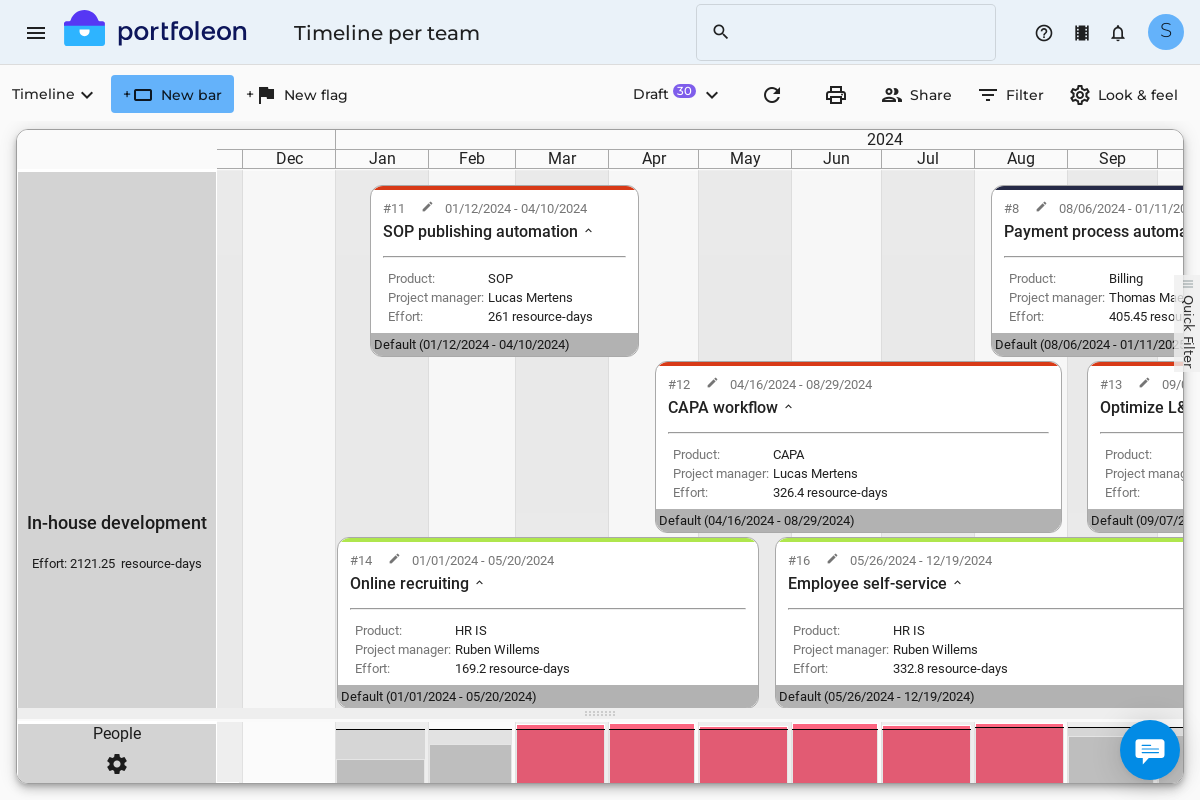
Scenario planning
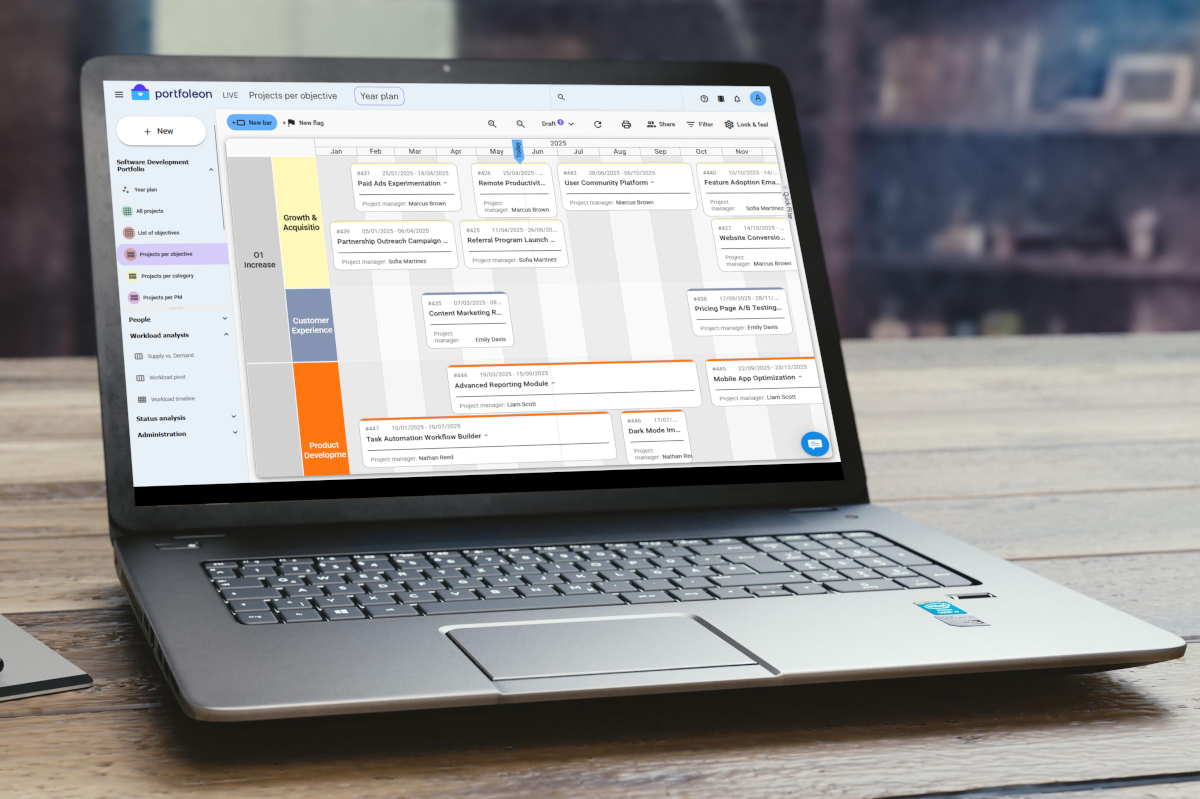
With Portfoleon, scenario planning becomes a natural part of strategic work. Teams can create multiple versions of a plan, each with its own roadmap, and explore different approaches by easily switching between them. This flexibility helps organizations evaluate options and make more informed decisions.
Monitoring progress throughout the year
As projects move forward, progress toward key results becomes visible. Portfoleon encourages meaningful status reporting – engaging project managers in a way that feels purposeful, not bureaucratic. This connection between daily work and strategic goals brings clarity and motivation to the entire team.
 Sign Up With Google